What Is a Case? What Is a Variable or Attribute?
When we work with data, sometimes confusion starts with the language we use…long before we even get to the graph or a conclusion.
Before students can compare groups, identify trends, or draw conclusions, they need clarity around foundational data concepts like case and attribute or variable. These terms show up across our subject areas and beyond when we work with data. Yet they are often used inconsistently or, worse still, left undefined for our students.
Here we will unpack what these terms mean, why they matter for sensemaking, and how educators can help students build a shared data language that supports deeper working with and reasoning from data.
Why Data Language Matters for Sensemaking
When students struggle with data tasks, which we hear about a lot ;), the issue sometimes is even more fundamental than struggles with executing or computation — it’s about the underlying structure of data.
If students aren’t sure:
- What counts as “one thing” in a dataset, or
- What information describes that thing,
then reading data visualizations, analyzing data patterns, or drawing claims becomes more like guesswork then systematic work with the data.
Clear data language helps students:
- Collect data and organize datasets more intentionally,
- Ask better questions of and from data,
- Transfer data skills across topic areas, subjects, and tools/platforms,
- Engage more confidently in data-based discussions, etc.
This is especially important as students are deciding how to collect their own data or working with real-world data that someone else has collected. Understanding data structure, and having consistent language to discuss it, can be a huge first step in successfully working with data. So let’s explore.
What Is a Case?
First, a case is one instance in a dataset. It can be an individual, item, or entity that data were collected about. In other words, it is the “who” or “what thing” being studied.
Examples of cases:
- Each student who responds to a class survey asking for students’ favorite ice cream flavors.
- Each city in a climate dataset comparing climates across cities.
- Each individual animal tracked in a field study that is measuring behaviors of individuals within a population.
- Each school in a comparison of schools across the district.
Every dataset has a case structure, even if it’s not explicitly named. It is the instance or observation that data is being recorded. Therefore, what qualifies as a case is entirely dependent upon what question you are asking and/or how the data are being collected.
Helping students identify the case answers the question: “What is one example in this dataset?” It provides students a sense of how much data were collected and what level of specificity they can talk about. For example, if you have data about grade levels but not individual students from each grade then you can discuss patterns by grade level but not by student.
Ideally each case is one row in a data table.
Teaching tips:
- Ask students when they are early into working with a dataset: “What is one case in this data?” This is best asked when exploring the data, before jumping to patterns or trends. This helps students slow down and pay more attention to what is actually in the data.
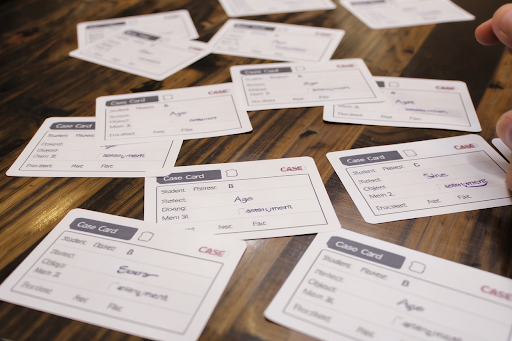
- Providing students with case cards, see image below for example, where each card represents a case of data that were collected. Students can complete these, or you can use your own set of playing cards, etc.
What Is a Variable (or Attribute)?
Second, now that we have a sense of our unit of measuring data, a case. The next piece of data structure is understanding that a variable (often called an attribute) is a characteristic about each case. In other words, it is the things we are actually measuring, observing, recording, etc. about the case.
Examples of variables:
- We could (and do) record 3 variables of homeroom, grade level, and attendance rate for each student (case).
- We could measure 3 variables of temperature, rainfall, and date as climate data for a city (case).
- We could record the 4 variables of species, mass, sex, and lifespan of tagged individual animals (case).
- We could track 2 variables per school (case) as enrollment size and graduation rate.
The variables (or attributes) we measure are completely dependent upon what we want to know with our data…and thus informed by our question(s).
Ideally, each case has a value for each variable. And If cases are the rows, variables are the columns.
Teaching tips:
- Ask students when they are early into working with a dataset: “What are we looking at in these data?” This is best asked when exploring the data, before jumping to patterns or trends. This helps students slow down and pay more attention to what variables are and are not in the dataset.
- Providing students with case cards, see image above for example, where each card has multiple pieces of information (variables) included on it. Students can answer these variables for themselves, or you can use your own set of playing cards (i.e., number, suit, color), etc.
Case vs. Variable: Why the Distinction Matters
Key distinction to emphasize with students:
- Cases = what we’re measuring data on
- Attributes/variables = what about the person, place, thing we are measuring
Students often mix these up — and that confusion affects everything downstream.
For example:
- If students treat cases as variables, they may create confusing graphs (as we visualize the data values across cases of variable(s)).
- If students aren’t clear on what the case is, then their comparisons can lose meaning or be nonsensical.
- If students can’t name variables, they struggle to explain what a visualization is representing.
Explicitly naming cases and attributes supports:
- Better graph choices
- Clearer data claims
- Stronger explanations grounded in evidence
This clarity is essential across disciplines — not just in math.
Using Case Cards to Build Conceptual Understanding
As we have alluded to above, one powerful instructional move is to use case cards — tangible or digital representations of individual cases.
Each card represents a case, with values for multiple variables listed on the card.
This approach helps students:
- See how datasets are built from individual cases
- Practice physically organizing and regrouping data
- Explore how changing the case or variable selected changes the story
High-quality tools and resources:
- Tuva Case Cards – designed to support student-friendly data exploration, the default is for students to visualize data as actual cards (in Tuva Jr) or as rows of variables to the left side(in Tuva).
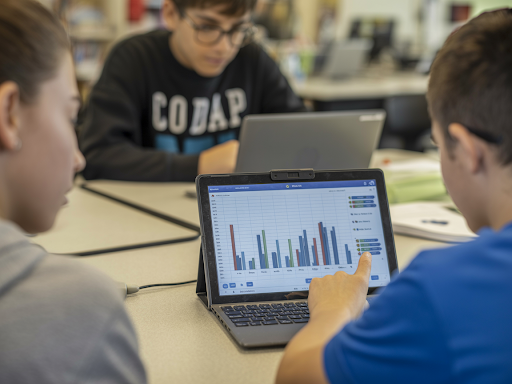
- CODAP (Common Online Data Analysis Platform) – allows students to dynamically explore cases and variables through tables and graphs
These tools help students move from abstract definitions to hands-on sensemaking.
🔗 Another resource that we highly recommend to check out is Andee Rubin’s work on statistical and data reasoning.
Helping Students Ask Better Questions About Data
Once students understand cases and variables (attributes), they’re better positioned to ask meaningful questions, such as:
- What variables differ the most across cases?
- Are there groups of cases that behave similarly?
- What variables might explain differences we see?
This shift moves students from reading data to reasoning with data — a key goal of data literacy instruction.
Supporting Teachers with Classroom-Ready Data Resources
If you’re looking for curated ways to help students find, organize, and structure data, Dataspire offers resources designed specifically to support this work.
Find and Organize Data
Explore classroom-ready resources that help students identify cases, variables, and meaningful structures in datasets.
🔗 https://www.dataspire.org/find-&-organize-data-resources
These resources are designed to be flexible across grade levels and content areas, supporting consistent data language and practices.
Final Thought: Language Shapes Understanding
When students clearly understand what a case is and how variables inform us about it, data stops feeling abstract. Instead, it becomes something they can organize, question, and explain.
Building a shared data vocabulary isn’t an extra step — it’s the foundation for meaningful data sensemaking.
